‘Millennials in the US Are Wealthy’ – A New Study Reveals

Are you a millennial? If you are, you should be happy with the findings of the most recent study on wealth and inequality. The said research claims that “not all millennials in the U.S. are actually struggling”. Most of them know how to earn not just to make a living but also to be able to save for the future. As such, they are aware of the possibilities of making their finances grow and work for them and their plans.
 Generation Y

Rawpixel.com/Shutterstock
Handling their finances efficiently, Generation Y has moved into emerging wealth, which probably each member has gained from Generation X. Though they graduated into the worst recession since the Great Depression, a few privileged individuals have been successful enough to put the cohort within reach of passing Generation X in terms of household wealth, according to a new study on wealth and inequality.
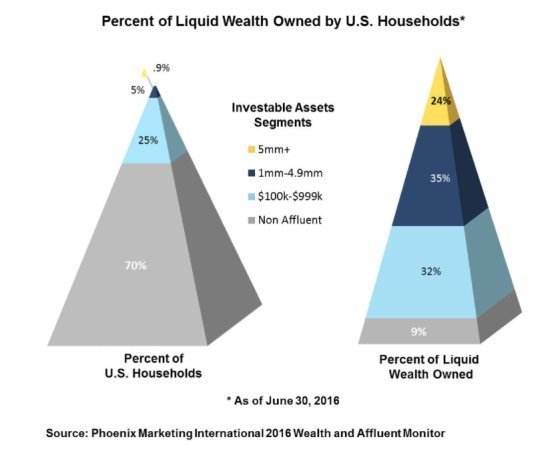
The annual Wealth and Affluent Monitor, published by Phoenix Marketing International, estimates that Millennials now comprise 13% of what they call the “wealthy and affluent market.” This finding is defined as households with at least $100,000 in investible assets. That group holds 91% of the total investible assets in the U.S.
“Generation X — the smaller generation between Baby Boomers and Millennials — makes up 17% of this market, and is increasingly faced with the financial challenges of aging parents and education costs for their children,” —Phoenix Marketing International.
 Increase in the number of millionaires
According to Phoenix, the number of millionaire households in the United States has generally grown by more than 800,000 over the past five years. The lower 70% of the population holds just 9% of the liquid wealth available in America.
Ranking of millionaires by state shows greatest one-year gains in Utah, Michigan, Arizona and Ohio. The biggest declines are in New Mexico, South Dakota, Vermont, and Maine. Hence, pre- and post-financial crisis analyses show that District of Columbia bounces, Dakotas rises, while Arizona, Florida, and Michigan fall sharply. See the wealth distribution chart below to have a better picture of the data sought:
 Phoenix used data from a combination of sources including the Survey of Consumer Finance (SCF) as well as Nielsen-Claritas to come up with its findings.
 Cities that Wealthy Millennials Actually Call Home
There were some changes among the top 10 states ranked in 2016 by the ratio of millionaire households to total households. The top 10 states are:
- Maryland (7.55%) – remained #1, where it has been since 2011
- Connecticut (7.4%) – remained #2, unchanged in 2016
- New Jersey (7.39%) – moved up one place in 2016
- Hawaii (7.35%) – declined one place in 2016
- Alaska (7.15%) – unchanged from 2015
- Massachusetts (6.98%) – unchanged from 2015
- New Hampshire (6.82%) – unchanged from 2015
- Virginia (6.64%) – unchanged from 2015
- District of Columbia (6.32%) – up one place from 2015
- Delaware (6.28%) – down one place in 2016
 Contributing Factors
A strengthening economy and employment expansion have contributed to the increasing personal wealth in some states. Others are losing ground or recovering slowly. Perhaps the reason for this decline is that they were hit hard by the recession and their reliance on certain sectors.
The states with the greatest gains in the rankings are Utah (#17), Michigan (#29), Arizona (#30), and Ohio (#31), each of which rose five ranks from 2015.
The biggest decline in the ranking was New Mexico, which dropped 11 places, continuing a three-year decline in ranking from #27 in 2013 to #43 in 2016, reflecting the impact of a depressed oil and gas industry on the state’s economy. South Dakota and Vermont both dropped seven places to #33 and #19, respectively, while Maine dropped six places to #35.
An analysis by Phoenix also disclosed that more significant shifts and regional impacts of certain financial crises, recession, and slow recovery of jobs and wages over the past 10 years. For example:
- Michigan ranked #18 in 2006, but by 2011 had dropped to #26. Despite recent growth, ranked #29 in 2016.
- Florida ranked #10 in 2006, but by 2011 had dropped to #19 and ranked #32 in 2016.
- New York ranked #13 in 2006 but rose to #12 by 2011 before dropping to #18 in 2016 as the disparity in wealth, particularly between upstate and downstate, became more prevalent.
Meanwhile, the District of Columbia, which ranked #9 in 2006, dropped to #20 at the outset of the financial crisis but has bounced back to its pre-recession ranking at #9 in 2016. Other states, including North Dakota, South Dakota and Texas, have risen notably since before the financial crisis.
This infographic tells many things about Gen Y and why they all really matter.

Vaju Ariel/Shutterstock
More in Luxury
-
`
Camilla Bowles & Prince Charles Ask People to Remember The Elderly This Holiday Season
Every year as the holiday season begins, we rush to the shopping centers and wait in long queues just to grab...
December 27, 2021 -
`
Baby Mama Olivia Munn Welcomes First Child With John Mulaney
You might think that this is wholesome news and there is nothing problematic about it – but guess again! As it...
December 23, 2021 -
`
Being A Feminist – The Dad Version
Feminism – an ideology that works to establish social, personal, economic, and political equality of humankind. In this day and age,...
December 22, 2021 -
`
Starting a Business Can Be Overwhelming–Here’s How You Can Get Over Your Fears & Start Building Your Company
Successfully building a business from the ground up, is not an achievement that all people can claim to have done. It...
December 22, 2021 -
`
Too Busy Working as a Corporate Executive to Manage Your Finances? These Are The Simple Steps You Can Take Today
Corporate executives often find themselves in an interesting predicament. After they’ve managed to put in the work to nab the high-paying...
December 21, 2021 -
`
Leonardo DiCaprio Buys a $9.9 Million Beverly Hills Mansion
Leonardo DiCaprio is no stranger in the world of Hollywood – and if you don’t know him, what have you been...
December 17, 2021 -
`
Kevin Hart Drops $7 Million on The Property Next to His Calabasas Mansion
People often say that kindness is making someone laugh, even if it’s only for a moment. Well, going by that logic,...
December 8, 2021 -
`
Two Decades Worth Of Jennifer Aniston’s Real Estate Grabs – Take A Look!
Jennifer Aniston! Who doesn’t know and love the superstar who breathed life into iconic characters like Rachel Green, Rosie Dickinson, Rose...
December 7, 2021 -
`
Let’s Hear it For The Long-Awaited Film, House of Gucci
Have you watched the House of Gucci yet? The movie has got to be one of the most anticipated ones of 2021 –...
December 1, 2021


You must be logged in to post a comment Login